Understanding ECG changes makes them easier to recognise
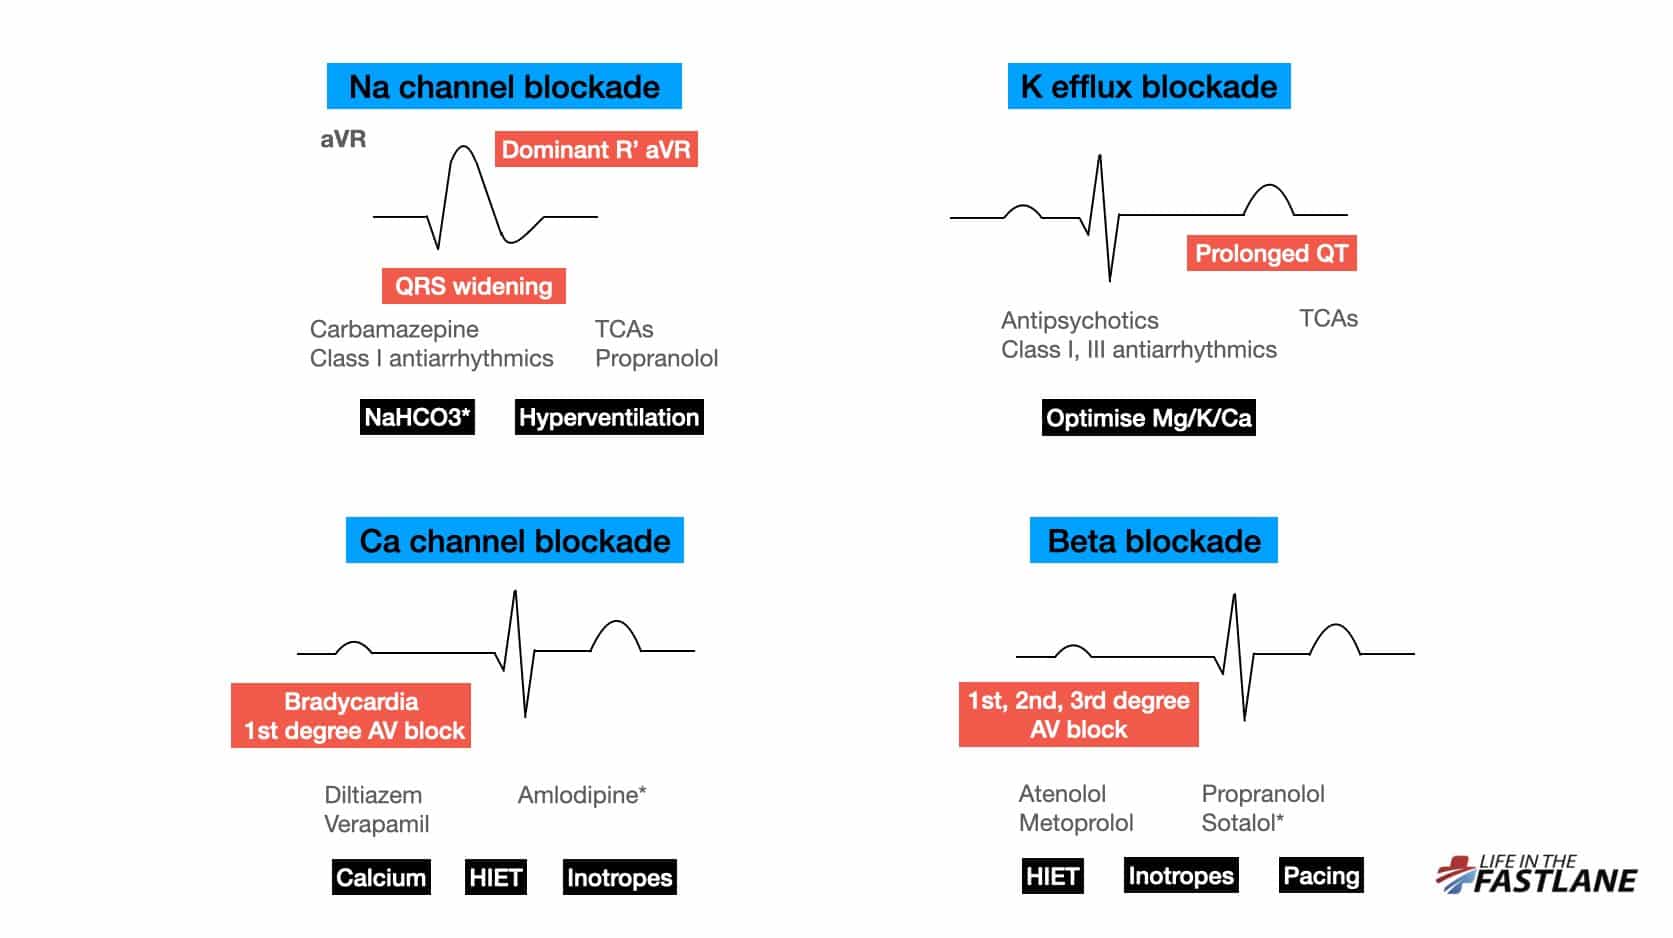
We may have heard that Na channel blockade causes “right axis deviation of the terminal QRS”. But what does this actually mean?
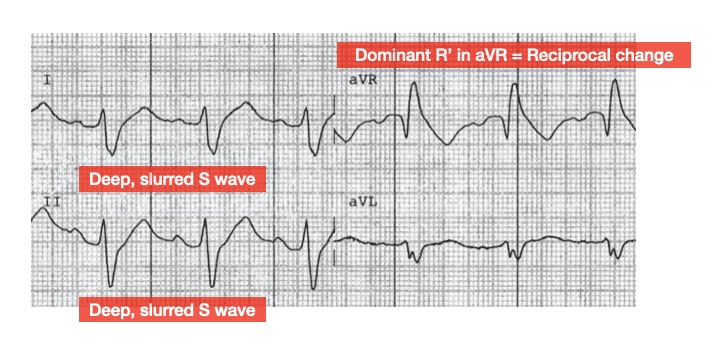
Well, the right-sided intraventricular conduction system is more susceptible to Na channel blocker toxicity than the left. This leads to delayed depolarisation of the right ventricle (RV). As is the case in right bundle branch block (RBBB), delayed RV conduction manifests as deep, slurred S waves in leads I, II, V5-6.
aVR is not a real lead – it is calculated from leads I and II and is a mirror (reciprocal) image of changes seen in these leads:
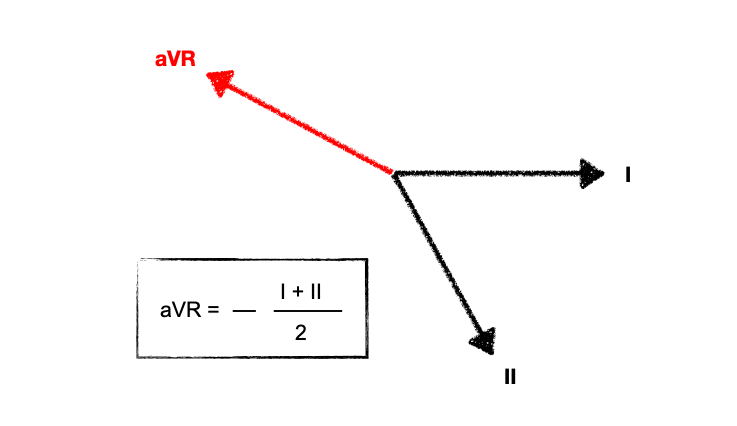
Deep, slurred S waves of delayed RV conduction are thus reflected as a dominant R’ wave in aVR. The “amplitude” of R’ in aVR is mentioned frequently, but actually the pattern recognition of a widened R wave is just as important.
With worsening toxicity, left-sided conduction pathways are increasingly affected, eventually leading to a “sine wave” appearance reminiscent of hyperkalaemia.
Patients with tricyclic antidepressant (TCA) overdose are at increased risk of seizures with QRS > 100ms, and of ventricular dysrhythmias with QRS > 160ms. In practice, we assume this holds true for all types of sodium channel blockade, however the risk likely varies with differing agents. A cut-off of 200ms may be more relevant for flecainide overdose (see below).
NaHCO3 can improve conduction delay with resultant shortening of QRS. However, there can be a variable response to this. Do not continue to give repeated boluses unless there is a clear response. There have been case reports of death from this.
How and where do we measure the QT interval?
A reminder on measuring the QT interval. Don’t rely on the computer. The biggest pitfall of computer interpretation is including separate U waves in calculations, which leads to falsely high measurements of 600ms+.
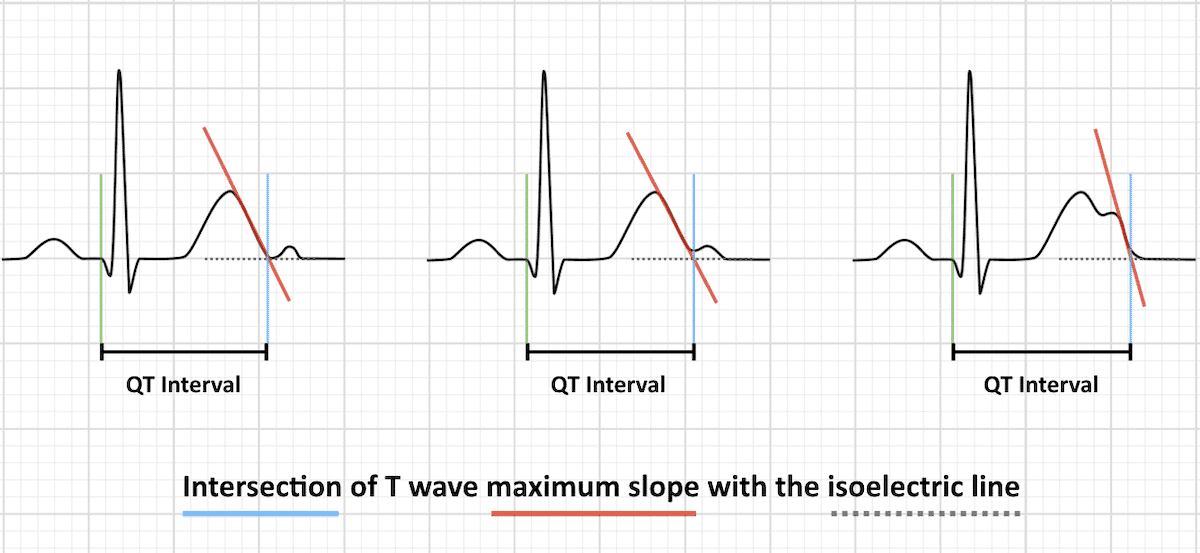
There is no specific correct lead to measure – simply use the lead with the longest interval. The general recommendation to measure II or V5-6 comes from the fact that these leads usually correlate to the overall vector of depolarisation.
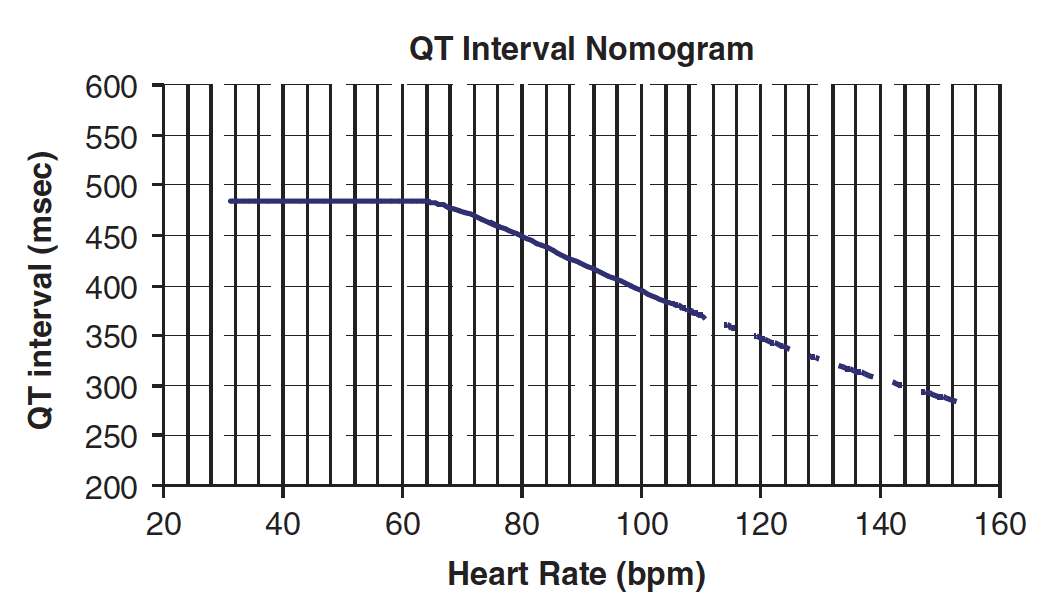
In tox ECGs, the absolute value can measured and plotted on the nomogram to predict if patients are at risk of TdP (Torsades de Pointes). Use this as opposed to QTc.
Read more about the effects of beta blocker and calcium channel blocker overdose on the ECG here.
Flecainide in overdose
Flecainide is a class IC anti-arrhythmic that exerts its action through potent blockade of Na and K channels with slow unblocking kinetics. At normal doses it does not prolong the action potential duration or QT interval.
Toxic dose is not well-established but is seen with ingestion as low as five times usual daily dose.
Its effects at therapeutic levels are greatest on the His-Purkinje system and ventricular myocardium, but with increasing toxicity extend to the AV node and atria and also cause left ventricular (LV) dysfunction.
Flecainide overdose appears to present with one of two morphologically distinct patterns based on the QRS duration. Patients with QRS duration < 200ms are likely to demonstrate a RBBB pattern, visible P waves, and relatively shorter QT interval. Those with QRS > 200ms are more likely to show LBBB, loss of P waves, a northwest axis, and a longer QT interval. Deaths have only been reported in patients with QRS duration > 200ms.
In therapeutic doses flecainide can be used for diagnostic purposes in patients with type 2 or 3 Brugada ECG patterns. However, in large ingestions patients without this congenital abnormality may also manifest an ECG resembling Brugada Syndrome.
The role of alkalinisation is less established than in other forms of Na channel blocker toxicity — NaHCO3 is indicated for patients with QRS prolongation or hypotension, but patients who do not respond to initial doses are unlikely to benefit from further administration. Inotropes may be required to support hypotension — ideally the choice of agent should be guided by bedside echo findings.
- ECG manifestations of Na channel blocker toxicity are primarily due to effects on the right-sided intraventricular conduction system — look for a widened QRS complex and a dominant, broad R’ wave in aVR
- Always measure the QT interval yourself. There is no specific correct lead to measure — simply use the lead with the longest interval
- Flecainide overdose appears to present with one of two morphologically distinct ECG patterns depending on QRS duration (< or > 200ms)