ECG Diagnostic criteria
- There are numerous voltage criteria for diagnosing LVH, summarised below
- The most commonly used are the Sokolow-Lyon criteria: S wave depth in V1 + tallest R wave height in V5 or V6 > 35 mm
- Voltage criteria must be accompanied by non-voltage criteria to be considered diagnostic of LVH
Voltage Criteria
Limb Leads
- R wave in lead I + S wave in lead III > 25 mm
- R wave in aVL > 11 mm
- R wave in aVF > 20 mm
- S wave in aVR > 14 mm
Precordial Leads
- R wave in V4, V5 or V6 > 26 mm
- R wave in V5 or V6 plus S wave in V1 > 35 mm
- Largest R wave plus largest S wave in precordial leads > 45 mm
Non Voltage Criteria
- Increased R wave peak time > 50 ms in leads V5 or V6
- ST segment depression and T wave inversion in the left-sided leads: AKA the left ventricular ‘strain’ pattern
Pathophysiology
- The left ventricle hypertrophies in response to pressure overload secondary to conditions such as aortic stenosis and hypertension
- This results in increased R wave amplitude in the left-sided ECG leads (I, aVL and V4-6) and increased S wave depth in the right-sided leads (III, aVR, V1-3)
- The thickened LV wall leads to prolonged depolarisation (increased R wave peak time) and delayed repolarisation (ST and T-wave abnormalities) in the lateral leads
Additional ECG changes seen in LVH
Causes of LVH
- Hypertension (most common cause)
- Aortic stenosis
- Aortic regurgitation
- Mitral regurgitation
- Coarctation of the aorta
- Hypertrophic cardiomyopathy
Handy Tips
- Voltage criteria alone are not diagnostic of LVH
- ECG changes are an insensitive means of detecting LVH (patients with clinically significant left ventricular hypertrophy seen on echocardiography may still have a relatively normal ECG)
ECG Examples
Example 1
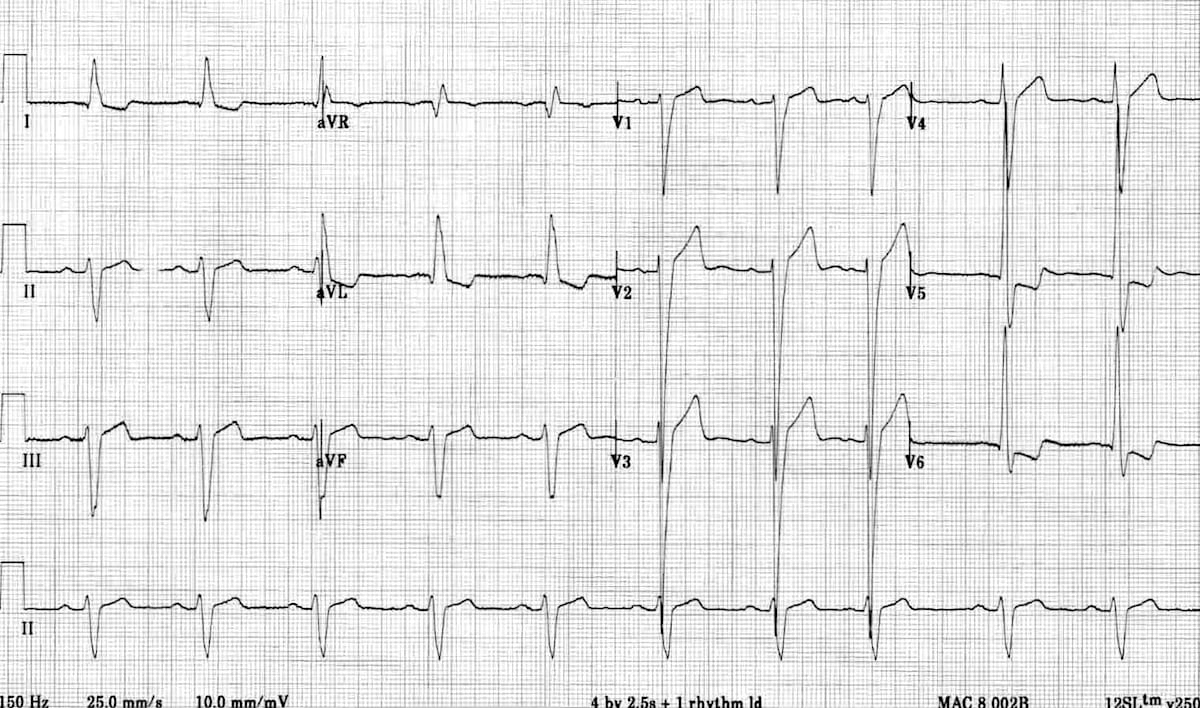
Left ventricular hypertrophy (LVH):
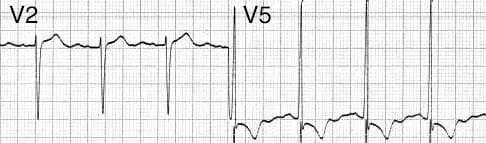
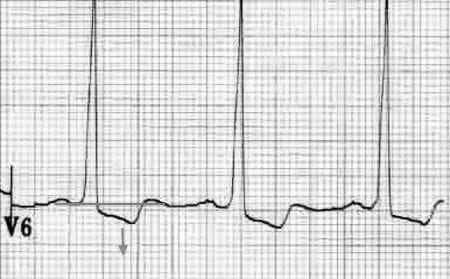
- Markedly increased LV voltages: huge precordial R and S waves that overlap with the adjacent leads (SV2 + RV6 >> 35 mm).
- R-wave peak time > 50 ms in V5-6 with associated QRS broadening.
- LV strain pattern with ST depression and T-wave inversions in I, aVL and V5-6.
- ST elevation in V1-3.
- Prominent U waves in V1-3.
- Left axis deviation.
Severe LVH such as this appears almost identical to left bundle branch block — the main clue to the presence of LVH is the excessively high LV voltages.
Example 2
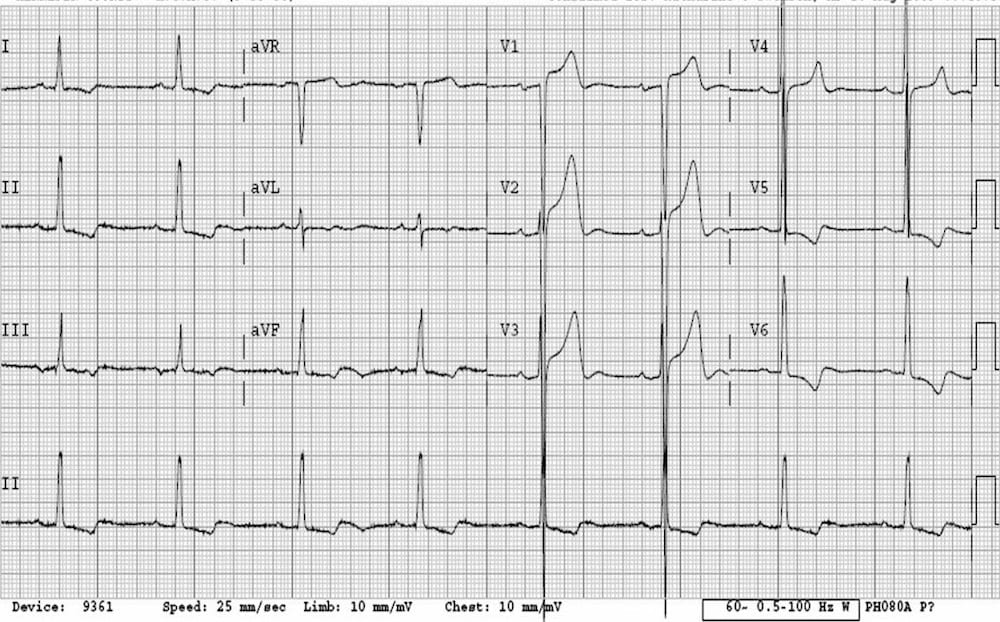
- There are massively increased QRS voltages — the S waves in V3 are so deep they are literally falling off the page!
- The ST elevation in V1-3 is simply in proportion to the very deep S waves (“appropriate discordance”).
- The LV strain pattern is seen in all leads with a positive R wave (V5-6, I, II, III, aVF).
References
Advanced Reading
Online
Textbooks
- Zimmerman FH. ECG Core Curriculum. 2023
- Mattu A, Berberian J, Brady WJ. Emergency ECGs: Case-Based Review and Interpretations, 2022
- Straus DG, Schocken DD. Marriott’s Practical Electrocardiography 13e, 2021
- Brady WJ, Lipinski MJ et al. Electrocardiogram in Clinical Medicine. 1e, 2020
- Mattu A, Tabas JA, Brady WJ. Electrocardiography in Emergency, Acute, and Critical Care. 2e, 2019
- Hampton J, Adlam D. The ECG Made Practical 7e, 2019
- Kühn P, Lang C, Wiesbauer F. ECG Mastery: The Simplest Way to Learn the ECG. 2015
- Grauer K. ECG Pocket Brain (Expanded) 6e, 2014
- Surawicz B, Knilans T. Chou’s Electrocardiography in Clinical Practice: Adult and Pediatric 6e, 2008
- Chan TC. ECG in Emergency Medicine and Acute Care 1e, 2004
LITFL Further Reading
Emergency Physician in Prehospital and Retrieval Medicine in Sydney, Australia. He has a passion for ECG interpretation and medical education | ECG Library |
MBBS DDU (Emergency) CCPU. Adult/Paediatric Emergency Medicine Advanced Trainee in Melbourne, Australia. Special interests in diagnostic and procedural ultrasound, medical education, and ECG interpretation. Co-creator of the LITFL ECG Library. Twitter: @rob_buttner